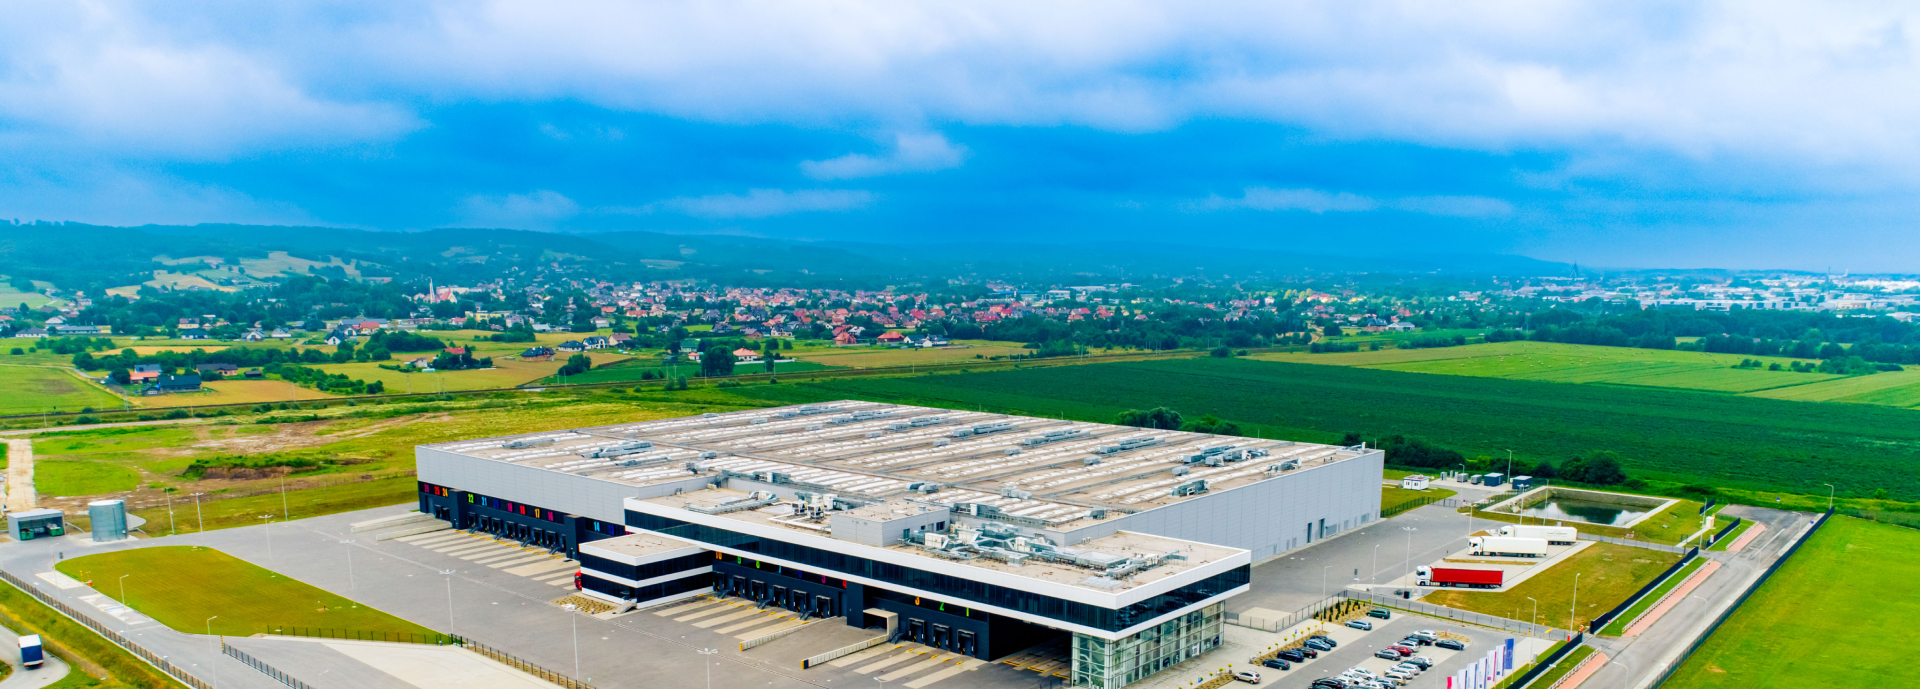
Greenhouse gas emissions of FFiL Śnieżka SA and Śnieżka ToC in scopes 1 and 2 in 2023[t CO2e]
| Information regarding past | Intermediate targets and years covered by the target | |||||||
|---|---|---|---|---|---|---|---|---|
| Base year emissions | Emissions in the reporting period |
Percentage change compared to to the year preceding the reporting year |
2025 | 2030 | Reduction target achieved by the base year (%) | |||
| Year | 2020 | 2021 | 2022 | 2023 | ||||
| Scope 1 greenhouse gas emissions | ||||||||
| Scope 1 greenhouse gas emissions gross emissions (t of carbon dioxide equivalent) | 1967.89 | 2679.11 | 1672.69 | 1907.70 | 14.05% | |||
| Percentage of scope 1 greenhouse gas emissions from regulated emissions trading systems (%) | n/a | n/a | n/a | n/a | n/a | |||
| Scope 2 greenhouse gas emissions | ||||||||
| Gross Scope 2 greenhouse gas emissions according to the location-based method (t of carbon dioxide equivalent) | 4972.94 | 4783.15 | 4800.41 | 4321.62 | -9.97% | |||
| Scope 2 greenhouse gas emissions according to the market-based method (t of carbon dioxide equivalent) | 4039.34 | 3623.57 | 0 | 0 | 0.00% | |||
| TOTAL 1+2 | ||||||||
| Scope 1 and 2 greenhouse gas emissions according to the location-based method (t of carbon dioxide equivalent) | 6940.83 | 7462.26 | 6473.1 | 6229.32 | -3.77% | |||
| Scope 1 and 2 greenhouse gas emissions according to the market-based method (t of carbon dioxide equivalent) | 6007.23 | 6302.68 | 1672.69 | 1907.70 | 14.05% | 45% | 50% | 68.24% |


